Connection State
Real-time monitoring of connection assets — Kafka, FTP, JDBC, Email, and more — including their health status, configuration details, and connection pool state.
Purpose
The Connection State view provides detailed visibility into every connection asset instance running on your cluster. While the Engine State overview shows which connections exist and their general health, the Connection State drill-down reveals the specifics: exactly which nodes are running each connection, the current state, configuration details, and any initialization failures.
Use Connection State to:
- Verify connections are healthy and accessible
- Debug connection failures and authentication errors
- Inspect connection configuration at runtime
- View connection logs for troubleshooting
- Restart connections when needed
Layout
The Connection State interface uses a two-tab layout:
Connection Tab
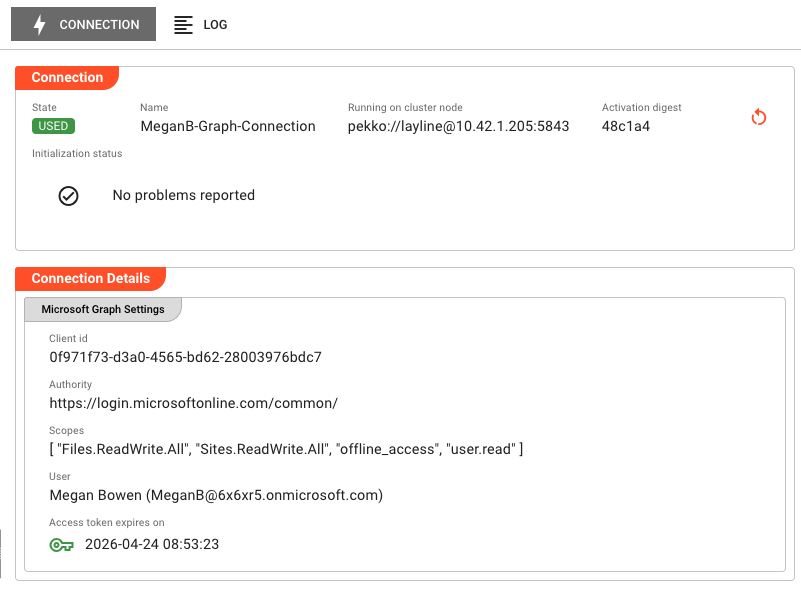
The primary view showing runtime state and connection-specific details:
Header Fields:
| Field | Description |
|---|---|
| State | Current execution state as a colored badge (green/yellow/red). See Connection States for all possible values. |
| Name | The connection name as defined in the project |
| Running on cluster node | The specific cluster node address where this connection instance is executing |
| Activation digest | Short hash of the deployment activation (first 6 characters; hover for full value). Only present when connection is activated. |
Initialization Status:
Displays a list of initialization failures if the connection failed to start properly. Shows "No problems reported" when initialization completed successfully. Common failures include:
- Missing or invalid credential references
- Configuration validation errors
- Network connectivity issues (cannot reach target host)
- Authentication failures (invalid credentials or expired tokens)
- SSL/TLS certificate validation errors
Connection Details:
The lower portion of the panel displays connection-specific details retrieved from the runtime. This varies significantly by connection type:
Connection-specific viewers:
Different connection types display relevant runtime configuration:
| Connection Type | Details Shown |
|---|---|
| Kafka | Bootstrap servers, connection check settings, SSL/TLS configuration, accessible topics |
| FTP / SFTP | Host, port, user, transfer mode (active/passive/SFTP), strict host checking, max parallel commands |
| JDBC | Database URL, driver class, connection pool settings |
| Email (MS 365 / Jakarta) | Server type, mailbox settings, authentication status |
| AWS | Region, credential source, service endpoints |
| Google Cloud | Project ID, credential source, API endpoints |
| SMB / NFS | Server address, share path, mount options |
| WebDAV | Server URL, authentication method |
| MS Graph | Tenant ID, application ID, permission scopes |
| Virtual FS | Base path, virtual mappings |
Many connection types include configurable health check parameters: check interval, max retries, and backoff factor. These control how aggressively the system tests connection availability and how quickly it recovers from transient failures.
Actions:
- Restart — If an Activation digest is displayed, a Restart button appears. Clicking this opens a confirmation dialog, then restarts the connection instance on the current node. The restart affects only the node where triggered — other nodes running the same connection are unaffected. The connection transitions through shutdown, then startup states. Monitor the state indicators to track restart progress.
Log Tab
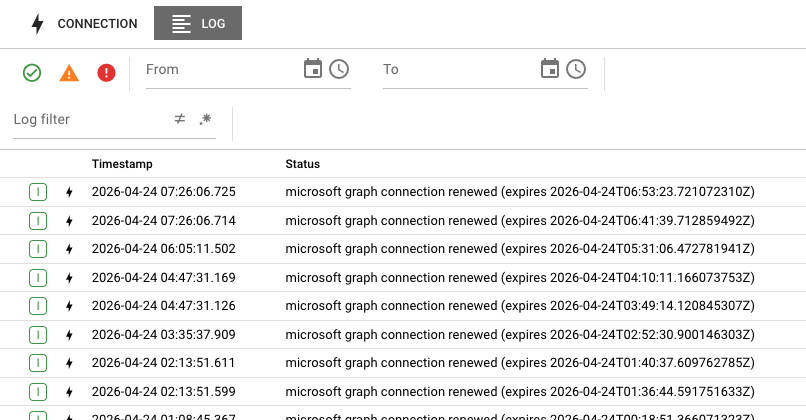
The Log tab displays the runtime log for this specific connection instance. This is the same log that would be written to disk on the cluster node, accessible here without needing SSH access to the server.
Log entries include:
- Timestamps for each event
- Severity levels (DEBUG, INFO, WARN, ERROR)
- Connection establishment and teardown events
- Authentication attempts and results
- Retry attempts and backoff information
- Configuration reload events
Use the log to troubleshoot:
- Connection timeouts or authentication failures
- SSL/TLS handshake errors
- Network interruptions and reconnections
- Credential expiration issues
The log view updates automatically as new entries are written. When troubleshooting an active issue, keep the Log tab open to see events as they happen.
Connection States
Connections can be in one of several states, shown as colored badges in the header:
| State | Badge Color | Meaning |
|---|---|---|
| UNUSED | Green | Connection is defined but not currently in use by any active component |
| USED | Green | Connection is active and being used by one or more services, sources, or sinks |
| CLUSTER_ROLE_MISMATCH | Green | Connection is healthy but running on a node with a different cluster role than expected |
| VERIFYING_CONFIGURATION | Yellow | Connection is validating its configuration during startup |
| VERIFYING_DEPENDENCIES | Yellow | Connection is checking that required dependencies are available |
| SHUTTING_DOWN | Yellow | Connection is gracefully closing and releasing resources |
| TERMINATED | Red | Connection was terminated due to an error condition |
| INITIALIZATION_FAILED | Red | Connection failed to initialize (check Initialization Status for details) |
| CONFIGURATION_FAILURE | Red | Connection configuration is invalid or incomplete |
| DEPENDENCY_FAILURE | Red | A required dependency (credential, network, etc.) is unavailable |
State transitions typically follow: VERIFYING_CONFIGURATION → VERIFYING_DEPENDENCIES → USED (or UNUSED) → SHUTTING_DOWN → UNUSED
If a connection enters a failure state (TERMINATED, INITIALIZATION_FAILED, CONFIGURATION_FAILURE, DEPENDENCY_FAILURE), check the Initialization Status section and the Log tab for failure details.
Common Tasks
Checking Connection Health
- Select the Connections category in the Engine State left panel
- Look for connections with error (red) or warning (yellow) icons
- Click the connection name to see cluster nodes running it
- Click a specific node to view detailed state and configuration
Investigating Connection Failures
- Navigate to the connection in the Engine State view
- Check the Initialization Status for startup errors
- Switch to the Log tab and look for ERROR-level entries
- Common causes:
- Credential expired or revoked (re-auth needed)
- Target server down or unreachable
- Firewall blocking the connection
- SSL certificate expired or untrusted
- Authentication method changed on target server
Verifying Connection Configuration
- Select the connection and node to view
- In the Connection tab, locate the connection-specific details section
- Verify the displayed configuration matches your expectations:
- Host/endpoint addresses
- Port numbers
- Authentication settings
- SSL/TLS configuration
The Connection State view shows the configuration as interpreted at runtime, which may differ slightly from the asset configuration in the project. This is the actual configuration being used by the running instance.
Restarting a Connection
- Navigate to the connection instance showing issues
- Verify the Activation digest field is present (indicates the connection is activated)
- Click the Restart button
- Confirm the restart in the dialog
- Monitor the state badge — it should transition through SHUTTING_DOWN → VERIFYING_CONFIGURATION → VERIFYING_DEPENDENCIES → USED
Restarting a connection only affects the single node where you trigger it. If the same connection runs on multiple nodes, each must be restarted individually if needed. This allows targeted recovery without cluster-wide impact.
Viewing Connection Logs for Troubleshooting
- Select the connection instance
- Click the Log tab
- Use the severity filters to focus on WARN and ERROR entries
- Look for patterns:
- Repeated connection failures (network/auth issues)
- SSL handshake errors (certificate issues)
- Authentication failures (credential issues)
- Timeout errors (slow target or network issues)
Type-Specific Behavior
Kafka Connections
Kafka connections display additional details:
- Bootstrap servers — List of Kafka broker addresses the connection uses
- Connection check — Health check configuration (enabled/disabled, check interval, max retries, backoff factor)
- Security settings — SSL/TLS configuration, truststore usage, identity certificate details
- Topics — List of topics the connection can access
FTP / SFTP Connections
FTP connections show:
- Host — Server address and resolved IP (if different)
- Port — Server port number
- User — Username for authentication (if not using key-based auth)
- Mode — Transfer mode (Active FTP, Passive FTP, SFTP, FTPS)
- Strict host checking — Whether SSH host key verification is enabled (SFTP only)
- Max parallel commands — Maximum number of concurrent FTP commands
If the connection is configured to use a local filesystem path for testing, a warning banner displays the path instead of FTP server details.
JDBC Connections
JDBC connections display:
- JDBC URL — Connection URL to the database
- Driver class — Fully qualified driver class name
- Connection pool — Pool size and timeout settings
Email Connections
Email connections (MS 365 and Jakarta) show:
- Server type — MS 365 or Jakarta (standard SMTP/IMAP)
- Server address — Mail server hostname/IP
- Mailbox — Configured mailbox name
- Authentication — Auth method and status
Cloud Provider Connections (AWS, Google Cloud)
Cloud connections display:
- Region — Default region for API calls
- Credential source — How credentials are provided (instance role, secret reference, etc.)
- Service endpoints — Custom endpoint URLs (if configured)
File Share Connections (SMB, NFS)
File share connections show:
- Server address — Hostname or IP of the file server
- Share path — Exported share or mount point
- Mount options — Protocol-specific options
Auto-Refresh
Connection State data refreshes automatically every 2 seconds while the tab is active. This ensures you see current state changes in real-time. The refresh pauses when you switch to another application tab to reduce server load.
When viewing the Log tab, new entries appear automatically as they are generated by the connection.
See Also
- Engine State Overview — High-level monitoring of all asset types
- Service State — Runtime service monitoring
- Source State — Monitoring input sources
- Sink State — Monitoring output sinks
- Cluster — Infrastructure and node management