Source State
Real-time monitoring of input sources — File, Kafka, FTP, S3, and more — including their connection status, processing metrics, and folder-level controls.
Purpose
The Source State view provides detailed visibility into every input source instance running on your cluster. While the Engine State overview shows which sources exist and their general health, the Source State drill-down reveals the specifics: exactly which nodes are running each source, the current connection and polling state, processing metrics, and (for directory-based sources) runtime folder enablement controls.
Use Source State to:
- Verify sources are connected and polling successfully
- Debug connection failures and configuration errors
- Monitor throughput metrics (messages processed, backlog)
- Enable or disable individual folders at runtime
- View source logs for troubleshooting
- Restart sources when needed
Layout
The Source State interface uses a two-tab layout:
Source Tab
The primary view showing runtime state, metrics, and source-specific details:
Header Fields:
| Field | Description |
|---|---|
| State | Current execution state as a colored badge (green/yellow/red). See Source States for all possible values. |
| Name | The source name as defined in the project |
| Running on cluster node | The specific cluster node address where this source instance is executing |
| Activation digest | Short hash of the deployment activation (first 6 characters; hover for full value). Only present when source is activated. |
Initialization Status:
Displays a list of initialization failures if the source failed to start properly. Shows "No problems reported" when initialization completed successfully. Common failures include:
- Missing or invalid connection assets
- Configuration validation errors
- Network connectivity issues (for remote sources)
- Authentication failures
- Directory or path access errors
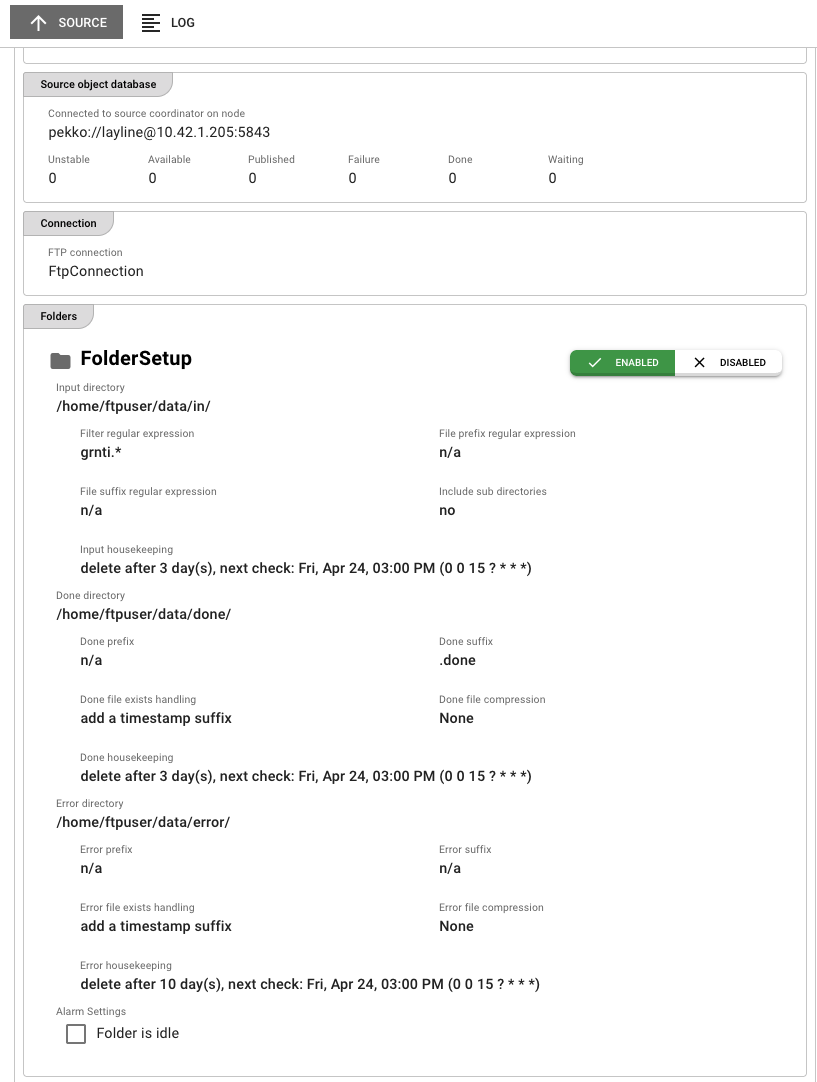
Source Details:
The lower portion of the panel displays source-specific details retrieved from the runtime. This varies significantly by source type:
Common sections for pollable/directory-based sources:
| Section | Content |
|---|---|
| Polling and Processing | Poll interval, processing settings, stable time detection |
| Throttling | Rate limiting configuration (if enabled) |
| Alarming | Idle alarms and other alerting configuration |
| Object Database | Tracking information for processed files/objects |
| Folder Setups | Directory configurations with enable/disable toggles |
| Metrics | Counters for processed, committed, retried, and rolled back files |
Source-specific viewers:
Different source types display relevant runtime details:
| Source Type | Details Shown |
|---|---|
| File System | Folder paths, file filters, polling configuration |
| FTP/SFTP | Remote connection status, server path, transfer mode |
| S3 | Bucket name, prefix, region, object listing |
| Kafka | Broker connections, topic offsets, consumer group status |
| Timer | Schedule configuration, next execution time |
| Message Queue | Queue depth, connection status, message counts |
Folder Enablement (Directory-Based Sources):
For sources that poll directories (File, FTP, S3, etc.), the Folder Setups section allows runtime control:
- Each configured folder appears with its path, filters, and done/error directories
- Toggle switches let you enable or disable individual folders without redeploying
- Disabled folders stop polling until re-enabled
- Changes take effect immediately on the running source
Use folder enablement to temporarily stop processing from a specific directory during maintenance or troubleshooting, without affecting other folders or requiring a full source restart.
Actions:
- Restart — If an Activation digest is displayed, a Restart button appears. Clicking this opens a confirmation dialog, then restarts the source instance on the current node. The source transitions through shutdown, then startup states. Monitor the state indicators to track restart progress.
Log Tab
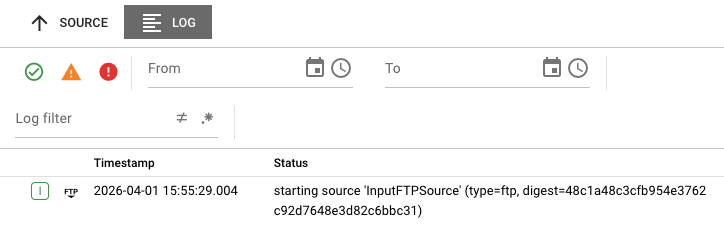
Displays the runtime log for this specific source instance. Use this to:
- View connection attempts and authentication results
- Trace polling cycles and file discovery
- Debug read errors and processing failures
- Monitor source lifecycle events
Logs are streamed in real-time from the cluster node running the source.
Source States
Sources transition through various states during their lifecycle. The state displayed in the detail panel reflects the current point in this lifecycle.
State Categories
States are grouped into three severity categories indicated by badge color:
| Color | Category | Meaning |
|---|---|---|
| Green | OK | Source is healthy and operating normally |
| Yellow | Warning | Source is in a transitional state or requires attention |
| Red | Failure | Source has encountered an error and is not operating correctly |
All Source States
Sources reuse the same state definitions as services:
| State | Category | Description |
|---|---|---|
| CLUSTER_ROLE_MISMATCH | OK | Source's cluster role assignment doesn't match current node (intentional non-placement) |
| UNUSED | OK | Source is configured but not currently in use |
| USED | OK | Source is active and polling/processing |
| VERIFYING_CONFIGURATION | Warning | Source is validating its configuration during startup |
| VERIFYING_DEPENDENCIES | Warning | Source is checking that all required dependencies are available |
| SHUTTING_DOWN | Warning | Source is shutting down and releasing connections |
| TERMINATED | Failure | Source was forcibly terminated |
| INITIALIZATION_FAILED | Failure | Source failed to initialize |
| CONFIGURATION_FAILURE | Failure | Configuration validation failed |
| DEPENDENCY_FAILURE | Failure | Required dependency (connection, resource) is missing or unavailable |
Metrics Reference
For pollable sources (File, FTP, S3, etc.), the Metrics section displays:
| Metric | Description |
|---|---|
| Processed messages | Total messages extracted from files/objects |
| Processed files | Total files/objects detected and processed |
| Committed files | Files successfully processed and committed |
| Retried files | Files that failed initially and were retried |
| Rollback files | Files that failed processing and were rolled back |
| Backlog files | Files detected but not yet processed (waiting in queue) |
- A growing Backlog with stable Processed count indicates the source is ingesting faster than workflows can process
- High Retried counts may indicate intermittent issues (network, permissions) or data quality problems
- Rollback files typically require investigation in the Log tab
State Indicators
In the Engine State left panel source list, icons provide at-a-glance status:
| Icon | Meaning |
|---|---|
| Green checkmark | Source is in an OK state (connected and polling) |
| Yellow warning triangle | Source is in a transitional or warning state |
| Red error icon | Source has failures and needs attention |
| Spinning/animated icon | Source is currently starting up |
| Power/shutdown icon | Source is shutting down |
Common Tasks
Checking If a Source Is Connected
- Locate the source in the Engine State left panel
- Look for the green checkmark icon
- Verify the State field shows
USED - Check Initialization status shows "No problems reported"
- For directory-based sources, verify Metrics show recent processed files
Debugging a Connection Failure
- Find the source with a red error icon in the left panel
- Select it to view the detail panel
- Check the State field for the specific failure state
- Review Initialization status for failure messages
- Switch to the Log tab for detailed error traces
- Common fixes:
CONFIGURATION_FAILURE— Review source configuration (paths, connection references)DEPENDENCY_FAILURE— Verify the referenced Connection asset is healthyINITIALIZATION_FAILED— Check credentials, network access, and path permissions
Monitoring Source Throughput
- Select the source from the left panel
- In the Source Details section, locate Metrics
- Observe:
- Processed files — Should increase as new files arrive
- Backlog — Should stay low; sudden spikes indicate processing delays
- Committed vs Rollback ratio — High rollbacks indicate processing errors
Temporarily Disabling a Folder
- Select a directory-based source from the left panel
- In the Source Details section, locate Folder Setups
- Find the folder you want to disable
- Click the toggle switch to disable it
- The folder stops polling immediately
- Re-enable when ready by toggling back on
Folder enable/disable state is runtime-only. When the source restarts, all folders revert to their configured default state (as defined in the project).
Restarting a Source
- Select the source from the left panel
- Verify the Activation digest field is displayed (restart requires this)
- Click the Restart button in the header
- Confirm the restart in the dialog
- Monitor the state indicators — the source will transition through shutdown and startup states
- Wait for the state to return to
USEDwith a green checkmark
Note: Restart only affects the source instance on the currently selected cluster node. Other instances on different nodes are not affected.
Viewing Source Logs
- Select the source from the left panel
- Click the Log tab
- Logs stream in real-time from the cluster node
- Use log entries to trace:
- Connection establishment
- Authentication results
- Polling cycles and file discovery
- Read errors and processing failures
Source Types
The Sources category in Engine State includes all source assets deployed to your cluster:
See Also
- Engine State Overview — Understanding the full Engine State interface
- Workflow State — Monitoring workflow instances
- Service State — Service-specific documentation
- Sink State — Monitoring output sinks
- Cluster Monitor — Infrastructure-level cluster health
- Source Assets — Configuring sources in projects