Sink State
Real-time monitoring of output sinks — Kafka, File, FTP, S3, and more — including their connection status, write metrics, and runtime controls.
Purpose
The Sink State view provides detailed visibility into every output sink instance running on your cluster. While the Engine State overview shows which sinks exist and their general health, the Sink State drill-down reveals the specifics: exactly which nodes are running each sink, the current connection and write state, processing metrics, and type-specific configuration details.
Use Sink State to:
- Verify sinks are connected and writing successfully
- Debug connection failures and write errors
- Monitor throughput metrics (messages written, files committed)
- View sink logs for troubleshooting
- Restart sinks when needed
Layout
The Sink State interface uses a two-tab layout:
Sink Tab
The primary view showing runtime state, metrics, and sink-specific details:
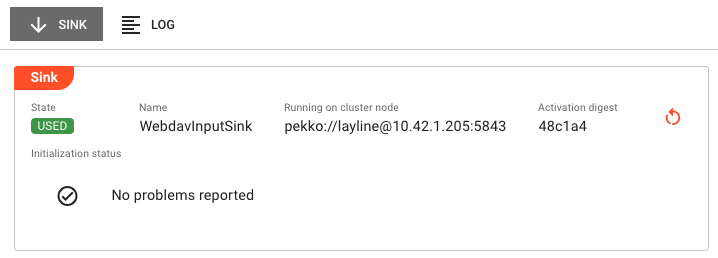
Header Fields:
| Field | Description |
|---|---|
| State | Current execution state as a colored badge (green/yellow/red). See Sink States for all possible values. |
| Name | The sink name as defined in the project |
| Running on cluster node | The specific cluster node address where this sink instance is executing |
| Activation digest | Short hash of the deployment activation (first 6 characters; hover for full value). Only present when sink is activated. |
Initialization Status:
Displays a list of initialization failures if the sink failed to start properly. Shows "No problems reported" when initialization completed successfully. Common failures include:
- Missing or invalid connection assets
- Configuration validation errors
- Network connectivity issues (for remote sinks)
- Authentication failures
- Target directory or bucket access errors
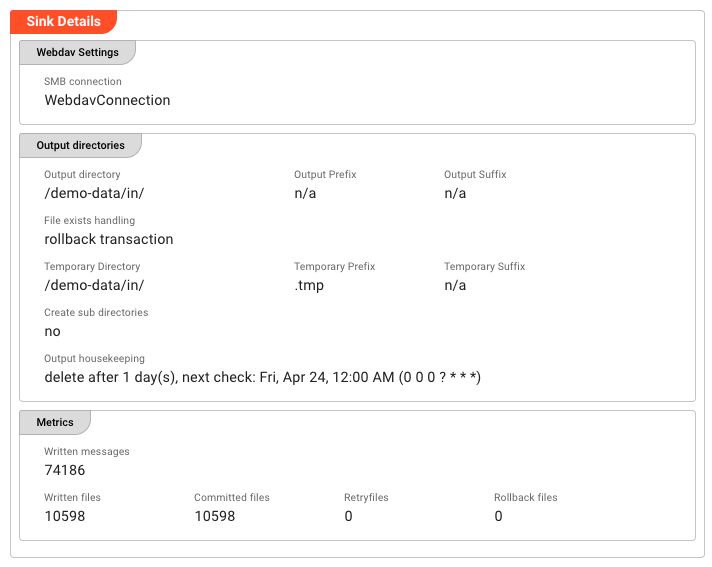
Sink Details:
The lower portion of the panel displays sink-specific details retrieved from the runtime. This varies significantly by sink type:
Sink-specific viewers:
Different sink types display relevant runtime details:
| Sink Type | Details Shown |
|---|---|
| Kafka | Connection name, parallelism setting, list of topics with exclusive partition access |
| File / FTP / SFTP | Connection name, directory configurations, file naming patterns |
| S3 | Bucket name, prefix, region settings |
| Kinesis | Stream name, partition key settings |
| EventBridge | Event bus name, rule configuration |
| SNS / SQS | Topic/queue ARN, message attributes |
| WebSocket | Endpoint URL, connection pool status |
Metrics:
All sink types display metrics relevant to their operation:
| Sink Type | Metrics Shown |
|---|---|
| Message-based (Kafka, Kinesis, SNS, SQS, etc.) | Processed Messages — Total count of messages successfully written |
| File-based (File, FTP, S3, etc.) | Written messages — Messages serialized to files Written files — Files created and written Committed files — Files successfully finalized Retry files — Files pending retry after transient failures Rollback files — Files rolled back due to errors |
For file-based sinks, the counters show the complete lifecycle: messages are first written to temporary files, then committed when the batch is complete, or rolled back if an error occurs. Retry files indicate transient failures that will be retried automatically.
Actions:
- Restart — If an Activation digest is displayed, a Restart button appears. Clicking this opens a confirmation dialog, then restarts the sink instance on the current node. The restart affects only the node where triggered — other nodes running the same sink are unaffected. The sink transitions through shutdown, then startup states. Monitor the state indicators to track restart progress.
Log Tab
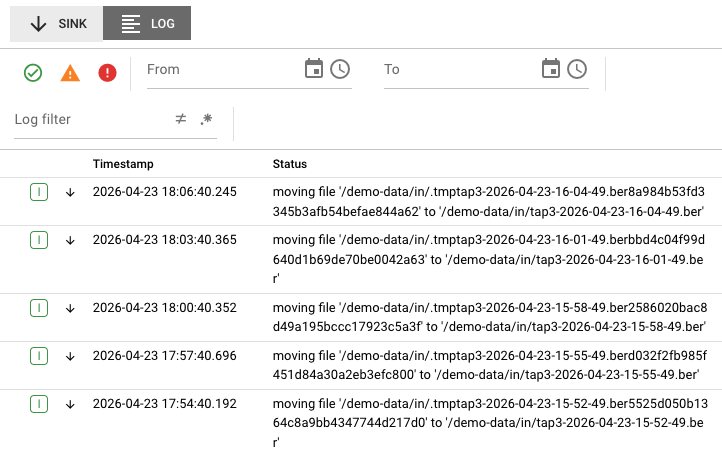
The Log tab displays the runtime log for this specific sink instance. This is the same log that would be written to disk on the cluster node, accessible here without needing SSH access to the server.
Log entries include:
- Timestamps for each event
- Severity levels (DEBUG, INFO, WARN, ERROR)
- Connection establishment and teardown events
- Write operation confirmations and failures
- Retry attempts and backoff information
- Configuration reload events
Use the log to troubleshoot:
- Connection timeouts or authentication failures
- Write errors (disk full, permission denied, etc.)
- Serialization errors
- Network interruptions and reconnections
The log view updates automatically as new entries are written. When troubleshooting an active issue, keep the Log tab open to see events as they happen.
Sink States
Sinks can be in one of several states, shown as colored badges in the header:
| State | Badge Color | Meaning |
|---|---|---|
| Running | Green | Sink is active and processing messages normally |
| Starting | Yellow (spinning) | Sink is initializing, establishing connections |
| Stopping | Yellow | Sink is shutting down, flushing buffers |
| Stopped | Gray | Sink has been stopped (not running) |
| Error | Red | Sink encountered an error and stopped processing |
| Warning | Yellow | Sink is running but has non-fatal issues |
State transitions typically follow: Starting → Running → Stopping → Stopped
If a sink enters the Error state, check the Initialization Status section and the Log tab for failure details.
Common Tasks
Checking Sink Health
- Select the Sinks category in the Engine State left panel
- Look for sinks with error (red) or warning (yellow) icons
- Click the sink name to see cluster nodes running it
- Click a specific node to view detailed state and metrics
Investigating Write Failures
- Navigate to the sink in the Engine State view
- Check the Initialization Status for startup errors
- Switch to the Log tab and look for ERROR-level entries
- Common causes:
- Connection credentials expired (re-auth needed)
- Target directory/bucket permissions changed
- Network connectivity issues
- Disk space exhausted (for local file sinks)
Monitoring Throughput
- Select the sink and node to view
- In the Sink tab, locate the Metrics section
- For message sinks: watch the Processed Messages counter increment
- For file sinks: monitor Written files vs Committed files — a growing gap indicates files pending finalization
Restarting a Sink
- Navigate to the sink instance showing issues
- Verify the Activation digest field is present (indicates the sink is activated)
- Click the Restart button
- Confirm the restart in the dialog
- Monitor the state badge — it should transition through Stopping → Starting → Running
Restarting a sink only affects the single node where you trigger it. If the same sink runs on multiple nodes, each must be restarted individually if needed. This allows targeted recovery without cluster-wide impact.
Viewing Sink Logs for Troubleshooting
- Select the sink instance
- Click the Log tab
- Use the severity filters to focus on WARN and ERROR entries
- Look for patterns:
- Repeated connection failures (network/auth issues)
- Write timeouts (slow target system)
- Serialization errors (message format mismatches)
Type-Specific Behavior
Kafka Sinks
Kafka sinks display additional details:
- Connection — The Kafka connection asset name
- Parallelism — Number of parallel writers per node
- Topics with exclusive partition access — List of topics this sink instance has exclusive write access to (in clustered deployments, partition assignment ensures each topic is written by only one node)
Metrics show Processed Messages — the total count of messages successfully produced to Kafka.
File-Based Sinks (File, FTP, SFTP, S3)
File sinks show comprehensive file lifecycle metrics:
- Written messages — Messages serialized to temporary files
- Written files — Temporary files created
- Committed files — Files successfully moved to final destination
- Retry files — Files with transient errors, queued for retry
- Rollback files — Files with permanent errors, rolled back
The directory configuration shows target paths, file naming patterns, and done/error directory routing.
Cloud Service Sinks (Kinesis, EventBridge, SNS, SQS)
These sinks display:
- Connection — The connection asset (AWS credentials, etc.)
- Target configuration — Stream name, event bus, topic ARN, or queue URL
- Region — AWS region (if applicable)
Metrics show Processed Messages for message-counting sinks.
Auto-Refresh
Sink State data refreshes automatically every 2 seconds while the tab is active. This ensures you see current metrics and state changes in real-time. The refresh pauses when you switch to another application tab to reduce server load.
When viewing the Log tab, new entries appear automatically as they are generated by the sink.
See Also
- Engine State Overview — High-level monitoring of all asset types
- Source State — Monitoring input sources
- Service State — Runtime service monitoring
- Connection State — Connection health and pool status
- Cluster — Infrastructure and node management