Extension State
Real-time monitoring of cluster-based processing extensions, including their runtime state, initialization health, and deployment status.
Purpose
The Extension State view provides visibility into extension instances running on your cluster. Extensions in layline.io are custom processing components that provide additional functionality beyond the core platform — such as custom processors, integrations, or specialized data handling. This page lets you monitor extension health, inspect deployment details, and diagnose initialization issues.
Use Extension State to:
- Verify extensions are initialized correctly on specific nodes
- Inspect activation and deployment details
- Monitor extension initialization status and failures
- View extension logs for errors and diagnostics
Layout
The Extension State interface uses a two-tab layout:
Extension Tab
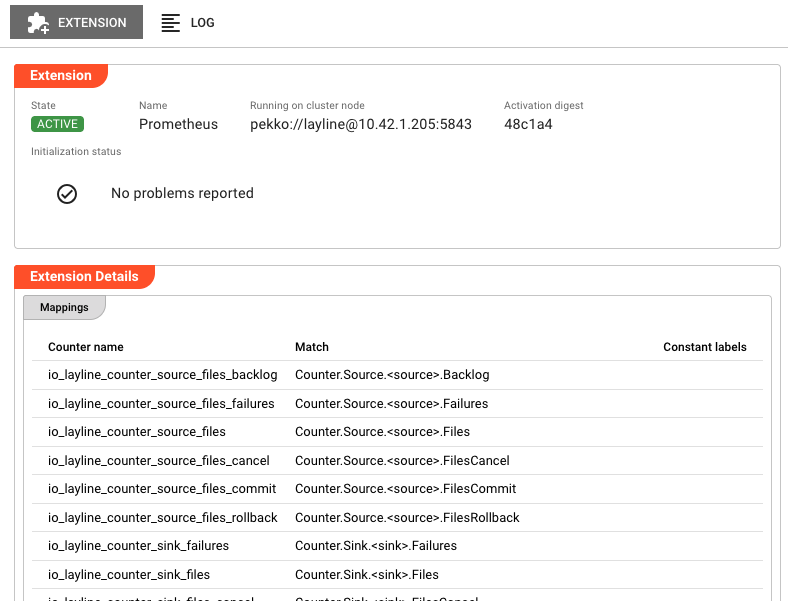
The primary view showing runtime state and extension details:
Header Fields:
| Field | Description |
|---|---|
| State | Current execution state as a colored badge (green/red). See Extension States for all possible values. |
| Name | The extension name as defined in the project |
| Running on cluster node | The specific cluster node address where this extension instance is executing |
| Activation digest | Short hash of the deployment activation (first 6 characters; hover for full value). Only present when extension is activated. |
Initialization Status:
Displays the result of extension initialization:
- No problems reported — Shown with a green checkmark when initialization succeeded
- Failure list — If initialization encountered errors, they are listed here with details
Extension Details:
The lower section displays extension-specific information loaded dynamically based on the extension type. This varies by extension implementation and may include configuration details, runtime parameters, or custom status information provided by the extension itself.
Log Tab
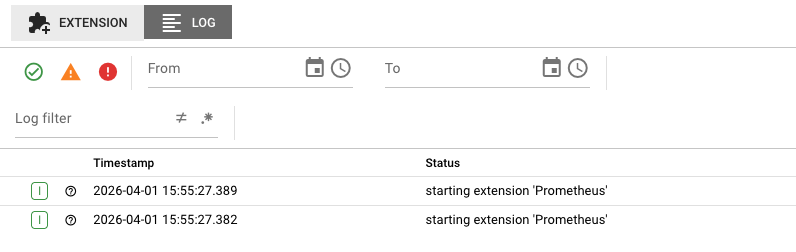
The Log tab displays the runtime log for this specific extension instance. This is the same log that would be written to disk on the cluster node, accessible here without needing SSH access to the server.
Log entries include:
- Timestamps for each event
- Severity levels (DEBUG, INFO, WARN, ERROR)
- Extension initialization events
- Runtime processing messages
- Error conditions and stack traces
Use the log to troubleshoot:
- Extension loading failures
- Class loading or dependency issues
- Runtime exceptions during processing
- Configuration validation errors
The log view updates automatically as new entries are written. When troubleshooting an active issue, keep the Log tab open to see events as they happen.
Extension States
Extensions can be in one of several states, shown as colored badges in the header:
Active States (Green)
| State | Description |
|---|---|
ACTIVE | Extension is initialized and running normally |
CLUSTER_ROLE_MISMATCH | Extension is active but the local cluster node role does not match the extension's required role. The extension functions correctly but may not be operating on the intended node type. |
Error States (Red)
Any state other than ACTIVE or CLUSTER_ROLE_MISMATCH is considered a failure state and displayed with a red badge.
When an extension shows a failure state, check the Initialization Status section and the Log tab for failure details. Common causes include:
- Missing extension files or corrupted deployment packages
- Class loading failures (missing dependencies)
- Configuration validation errors
- Incompatible extension version with the current platform
- Resource exhaustion (memory, threads)
Common Tasks
Checking Extension Health
- Select the Extensions category in the Engine State left panel
- Look for extensions with error (red) icons
- Click the extension name to see cluster nodes running it
- Click a specific node to view detailed state
Investigating Initialization Failures
- Navigate to the extension in the Engine State view
- Check the Initialization Status for specific error messages
- Switch to the Log tab and look for ERROR-level entries
- Common causes:
- Extension JAR/file not found or corrupted
- Missing dependencies required by the extension
- Version incompatibility with the layline.io platform
- Invalid extension configuration
Viewing Extension Logs for Troubleshooting
- Select the extension instance
- Click the Log tab
- Use the severity filters to focus on WARN and ERROR entries
- Look for patterns:
- Initialization failures during startup
- Class loading errors
- Runtime exceptions during message processing
- Configuration parsing errors
Extension Deployment Lifecycle
Extensions follow this lifecycle during deployment and operation:
- Deployment — Extensions are selected during deployment configuration and uploaded to cluster nodes
- Initialization — The extension is loaded, validated, and initialized on each node where it is deployed
- Active — The extension is running and available for use by workflows
- Shutdown — When a deployment is deactivated, extensions are gracefully shut down
Auto-Refresh
Extension State data refreshes automatically every 2 seconds while the tab is active. This ensures you see current state changes in real-time. The refresh pauses when you switch to another application tab to reduce server load.
When viewing the Log tab, new entries appear automatically as they are generated by the extension.
See Also
- Engine State Overview — High-level monitoring of all asset types
- Workflow State — Monitoring workflows that may use extensions
- Service State — Monitoring services that may interact with extensions
- Project Extensions — Configuring extensions in projects