Cluster Monitor
A view of the Cluster Monitor controller's current state and its live log.
Tabs
Cluster Monitor Tab
Shows the controller status:
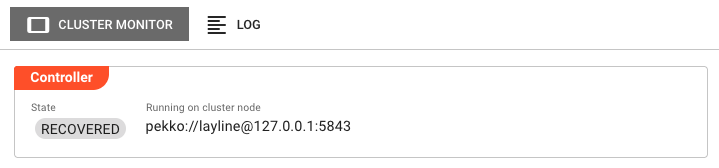
Controller section:
State — Current state of the Cluster Monitor controller (e.g., RECOVERED, RUNNING).
Running on cluster node — The address of the Reactive Engine node hosting the Cluster Monitor controller (e.g., pekko://[email protected]:5843).
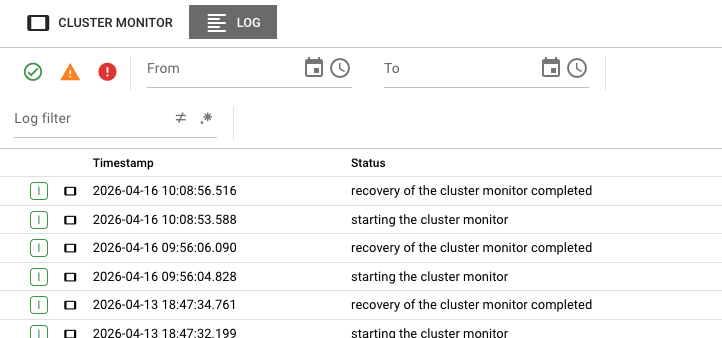
Log Tab
Shows the live log of the Cluster Monitor controller. Log entries include a timestamp and a status message (e.g., recovery of the cluster monitor completed, starting the cluster monitor).
Entries can be filtered by date range using the From and To fields.
See Also
- Engine State — Drill into individual workflow and component states per engine
- Scheduler — Understand how workloads are distributed across nodes