Stream Monitor
A read-only view of the Stream Monitor controller's current state, showing how many streams are active and when the oldest and newest streams were created.
Purpose
The Stream Monitor controller tracks the lifecycle of data streams running on a cluster. The Stream Monitor page in Operations gives you a live snapshot of the controller's health, the number of streams currently active, and the timestamps of the oldest and newest streams. Use it to quickly verify that streams are being created and that the controller is running as expected, without having to inspect individual workflow deployments.
Tabs
The Stream Monitor view has two tabs:
- Stream Monitor — controller status and stream statistics
- Log — live log output from the stream monitor controller
Stream Monitor (overview tab)
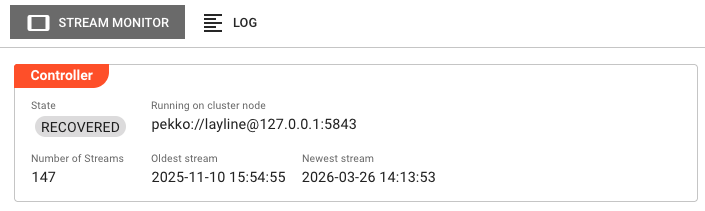
The overview tab shows a Controller panel with read-only status fields:
State — Current lifecycle state of the stream monitor controller (e.g. RUNNING).
Running on cluster node — The address of the cluster node that currently hosts the active stream monitor controller instance.
Number of Streams — The total number of streams currently tracked by the controller.
Oldest stream — Timestamp of the earliest stream currently tracked. Displays unknown if no streams are present.
Newest stream — Timestamp of the most recently created stream. Displays unknown if no streams are present.
These values update automatically when you navigate to this tab.
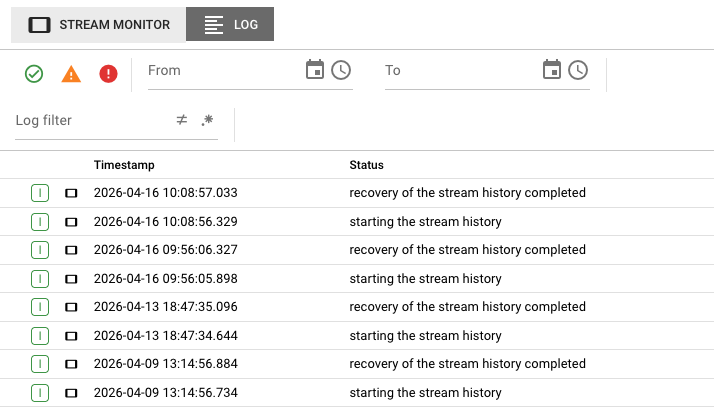
Log
Streams the live log output from the stream monitor controller process. Useful for diagnosing issues with stream creation, lifecycle transitions, or controller startup failures.
The log view uses the same shared log component as other Operations pages. Events can be selected to inspect details.
Behavior
- The overview tab polls the controller state once on load. Navigate away and back to refresh the values.
- All fields in the overview tab are read-only — the Stream Monitor page does not provide any configuration or control actions.
- If the controller is unreachable, all fields display
unknownand the State chip reflects the failure condition.
See Also
- Cluster Overview — Introduction to the cluster operations panel
- Engine State — View the runtime state of workflow engines on the cluster
- Audit Trail — Review the history of operational events on the cluster