Sniffer Directory
A read-only view of the Sniffer Directory controller's state, showing storage capacity for sniffer session data across the cluster.
Purpose
The Sniffer Directory controller manages the persistent storage used by sniffer sessions to capture and retain workflow messages. While sniffer sessions themselves are created and managed in the Audit Trail, the Sniffer Directory page shows the underlying storage controller's health and capacity metrics. Use it to verify that sufficient storage is available for diagnostic captures and to check that the controller is running properly.
Tabs
The Sniffer Directory view has two tabs:
- Sniffer Directory — controller status and storage capacity metrics
- Log — live log output from the sniffer directory controller
Sniffer Directory (overview tab)
The overview tab shows a Controller panel with read-only status fields:
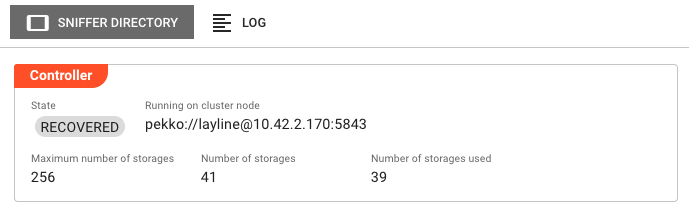
State — Current lifecycle state of the sniffer directory controller (e.g., RUNNING, RECOVERED).
Running on cluster node — The address of the cluster node that currently hosts the active sniffer directory controller instance.
Maximum number of storages — The maximum number of storage slots allocated for sniffer session data on this cluster.
Number of storages — The current number of storage slots that have been created.
Number of storages used — The number of storage slots currently in use by active or preserved sniffer sessions.
These values update automatically when you navigate to this tab.
Log
Streams the live log output from the sniffer directory controller process. Useful for diagnosing issues with storage allocation, session persistence, or controller startup failures.
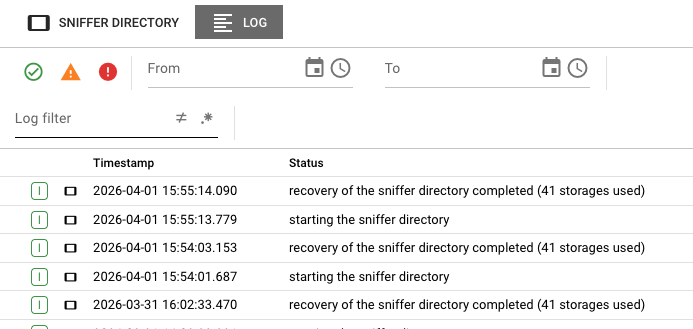
The log view uses the same shared log component as other Operations pages. Events can be selected to inspect details.
Behavior
- The overview tab polls the controller state once on load. Navigate away and back to refresh the values.
- All fields in the overview tab are read-only — the Sniffer Directory page does not provide configuration or control actions.
- If the controller is unreachable, all fields display
unknownand the State chip reflects the failure condition. - Storage slots are consumed when sniffer sessions are created in the Audit Trail and remain allocated until sessions are explicitly deleted.
Relationship to Sniffer Sessions
The Sniffer Directory controller is the infrastructure that enables sniffer sessions, but the two are accessed separately:
| Location | Purpose |
|---|---|
| Sniffer Directory (Cluster tab) | Monitor storage capacity and controller health |
| Sniffer Sessions (Audit Trail tab) | Create, manage, and inspect captured messages |
To create or interact with sniffer sessions, use the Sniffer Sessions tab in the Audit Trail.
See Also
- Audit Trail — Create and manage sniffer sessions, inspect captured messages
- Cluster Overview — Introduction to the cluster operations panel
- Alarm Center — Real-time alerts for operational issues including storage capacity