Workflow Processing Issues
My workflow is deployed and running, but no data is being processed.
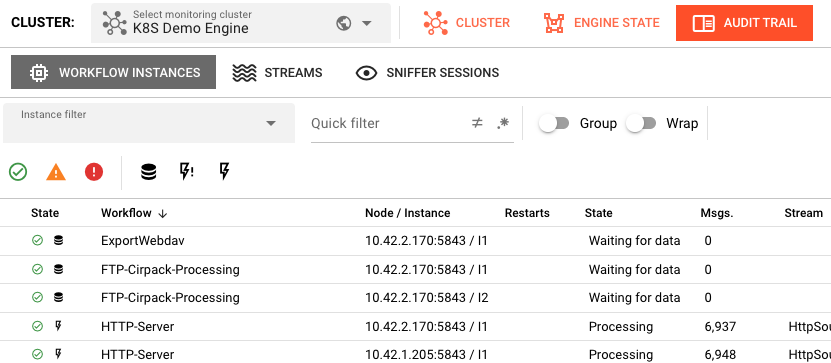 Operations → Engine State → Workflows showing workflow instances with their states and message counts
Common Symptoms
- Workflow shows as RUNNING but message count is 0
- Messages stuck in a particular processor
- No output being written to sinks
- Workflow processes some messages then stops
Diagnosis Checklist
1. Verify the Input Processor
Every workflow has exactly one Input Processor that drives execution. If it's not triggering, nothing flows.
Check in Operations → Engine State:
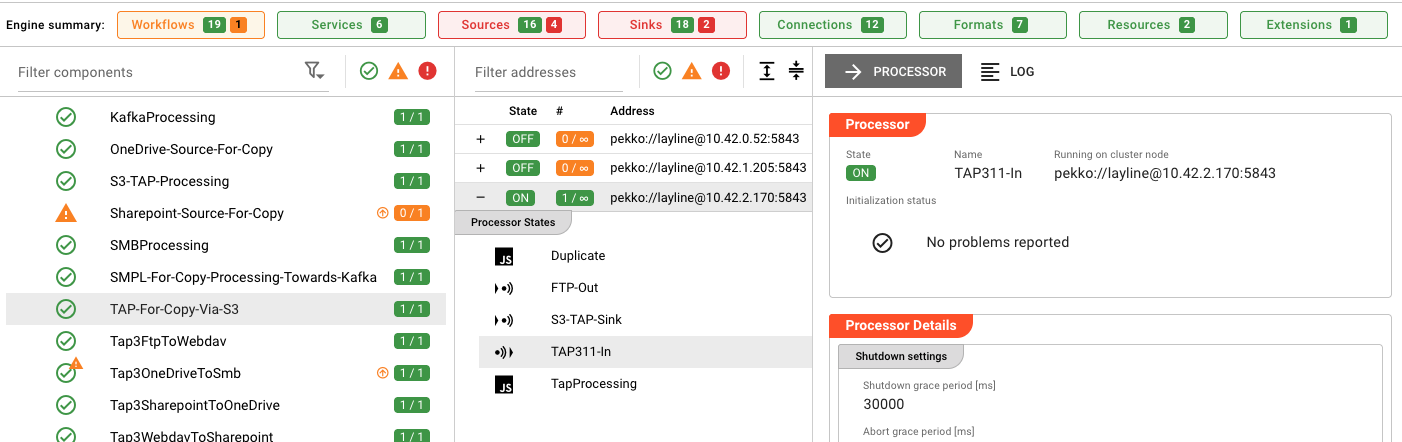 Engine State showing expanded workflow with component processors and their initialization status
- Find your workflow in the list
- Expand it to see component processors
- Check the Input Processor state:
- Should show HEALTHY or active processing indicators
- Look for error states or warnings
Common Input Processor issues:
| Processor Type | Check This |
|---|---|
| File | Is the source directory configured correctly? Are files present? |
| Timer | Is the schedule expression valid? Check cron syntax |
| Kafka | Is the consumer group active? Are there messages in the topic? |
| HTTP | Is the endpoint accessible? Check network/firewall |
| Database | Is the connection valid? Does the query return data? |
2. Check Message Flow
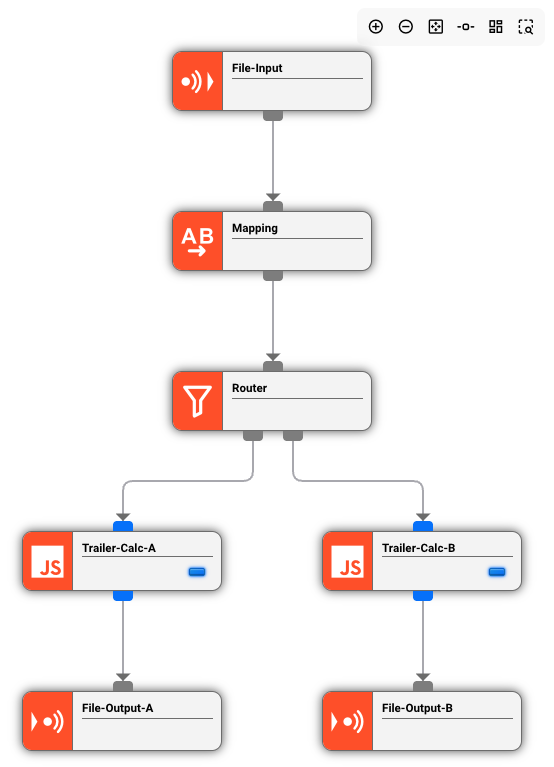 Workflow editor displaying processor connections: File-Input → Mapping → Router → Trailer-Calc-A/B → File-Output-A/B
In the Project view, open the Workflow:
- Verify connections: Are all processors properly connected?
- Check routing: Are route conditions correct? (e.g.,
msg.typeName === 'order') - Look for dead ends: Does every path lead to an Output Processor?
3. Inspect Processor Logs
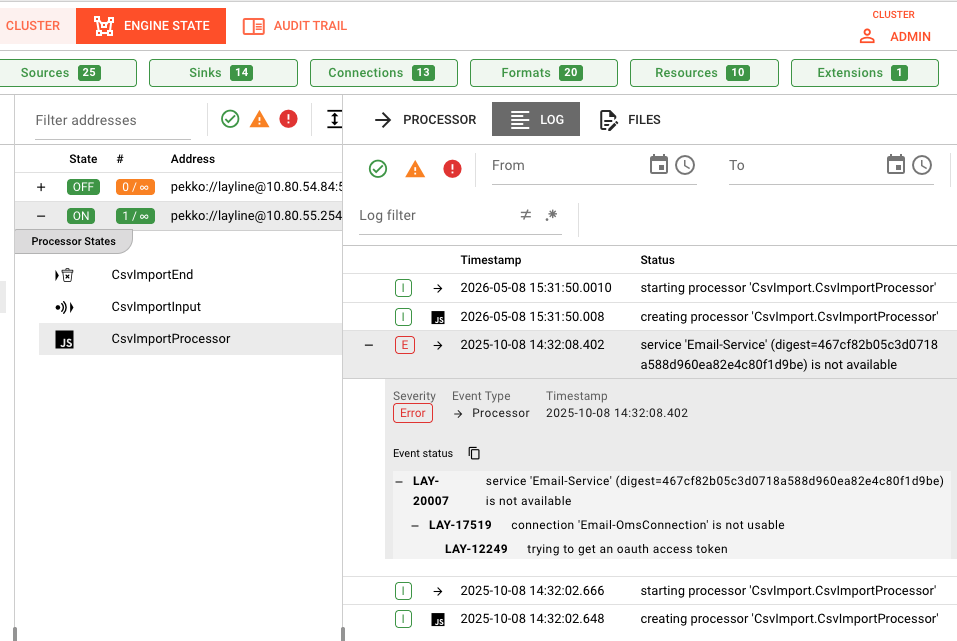 Operations → Engine State → Log tab showing error messages including service availability issues (Email-Service not available)
- Go to Operations → Engine State
- Select your workflow
- Click the Log tab
- Look for:
- JavaScript/Python errors
- Connection timeouts
- Format parsing errors
4. Test Message Processing
For Services with callable functions:
- Go to Operations → Engine State → Services
- Select the service
- Click the Functions tab
- Test with sample input
Common Error Scenarios
Messages Not Entering the Workflow
Symptoms: Input Processor shows 0 messages received.
Diagnosis:
Check:
- Source connection parameters
- Network/firewall access
- Authentication credentials
- File permissions (for file-based sources)
Messages Stuck Mid-Workflow
Symptoms: Messages enter but don't reach the output.
Diagnosis:
Common causes:
- JavaScript/Python runtime error in a Flow Processor
- Route condition that never matches
- Infinite loop or blocking operation
- Resource exhaustion
Resolution:
- Check processor logs for errors
- Simplify route conditions to test flow
- Review processor code for blocking calls
Output Processor Failures
Symptoms: Messages process but sink shows errors.
Diagnosis:
Check:
- Sink connection parameters
- Destination availability
- Write permissions
- Disk space (for file sinks)
Debugging Techniques
Add Logging
Add explicit logging to your processors:
// JavaScript Processor
stream.logInfo('Processing message: ' + message.id);
stream.logInfo('Payload: ' + JSON.stringify(message.data));
# Python Processor
stream.logInfo(f"Processing message: {message.id}")
stream.logInfo(f"Payload: {message.data}")
Use a Test Sink
Route messages to a DevNull Sink temporarily to isolate output issues:
If flow works to DevNull but not your sink, the issue is sink-specific.
Check Message Content
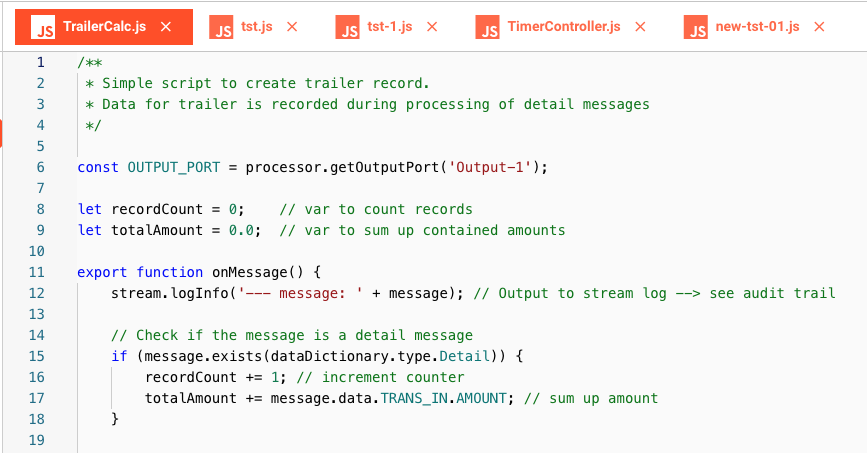 JavaScript Processor code editor showing TrailerCalc.js with logger statements for debugging message processing
Log the full message structure:
stream.logInfo('Message structure:');
stream.logInfo('  payload: ' + message.toJson());
See Also
- Engine State — Monitoring running workflows
- Audit Trail — Message execution history
- JavaScript Processor — Writing JavaScript processors
- Python Processor — Writing Python processors