Alarms and Error States
I'm seeing alarms or red error states in the Operations view.
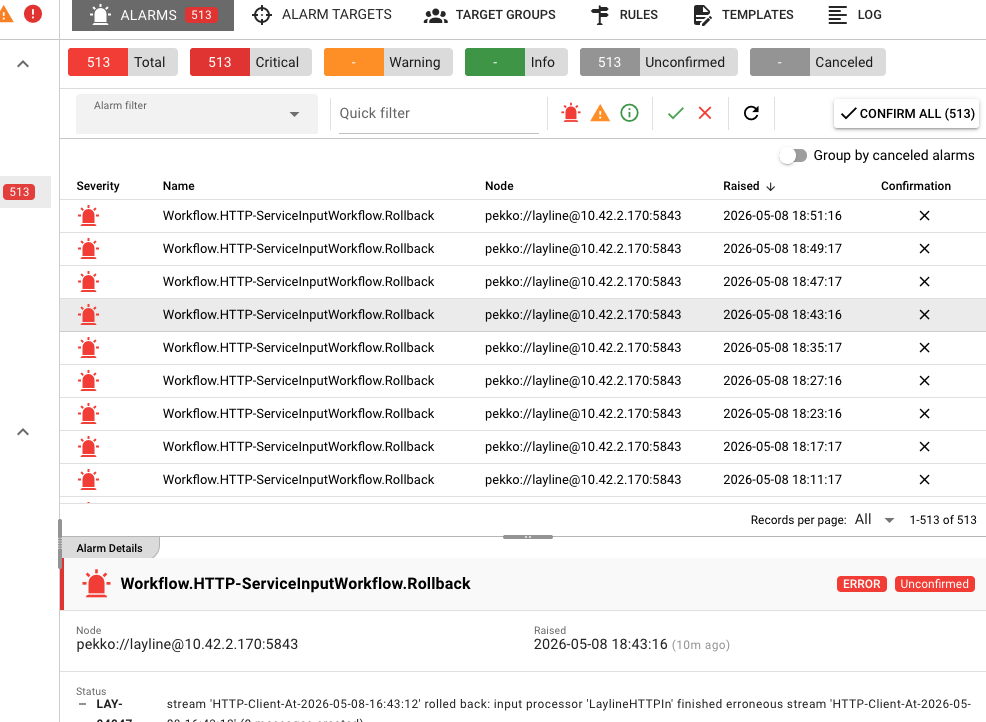 Alarm Center showing 513 active alarms with severity breakdown and Workflow.HTTP-ServiceInputWorkflow.Rollback error details
Common Symptoms
- Red/Orange badges in Engine State
- Alarms appearing in Alarm Center
- Error states on workflows, services, or connections
- Notifications about system issues
Understanding Alarm Severity
| Severity | Color | Meaning | Action Required |
|---|---|---|---|
| CRITICAL | 🔴 Red | System failure, data loss risk | Immediate attention |
| MAJOR | 🟠 Orange | Significant impact, degraded service | Address soon |
| MINOR | 🟡 Yellow | Limited impact, workaround available | Address when convenient |
| WARNING | 🟡 Yellow | Potential issue, monitoring recommended | Review |
| INFO | 🔵 Blue | Informational only | None |
Diagnosis Checklist
1. Check the Alarm Center
- Go to Operations → Alarm Center
- Review active alarms
- Click on an alarm for details
Key information to note:
- Source component (which workflow/service)
- Alarm message
- First occurrence time
- Count (how many times it fired)
2. Check Engine State
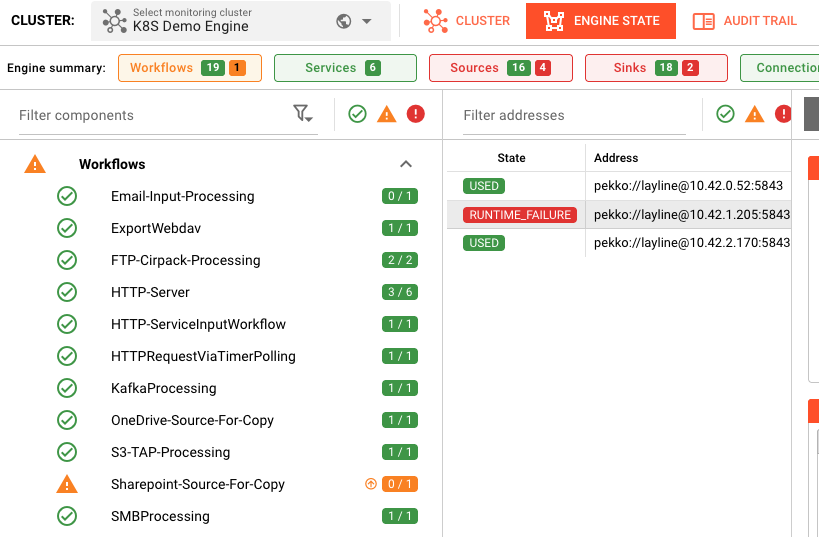 Engine State overview showing color-coded component status: 19 workflows, 6 services, 16 sources, 18 sinks with warning indicator on Sharepoint-Source-For-Copy
In Operations → Engine State:
- Look for red/orange status indicators
- Expand workflows to see processor-level states
- Check the middle panel for node-specific issues
3. Review Component Logs
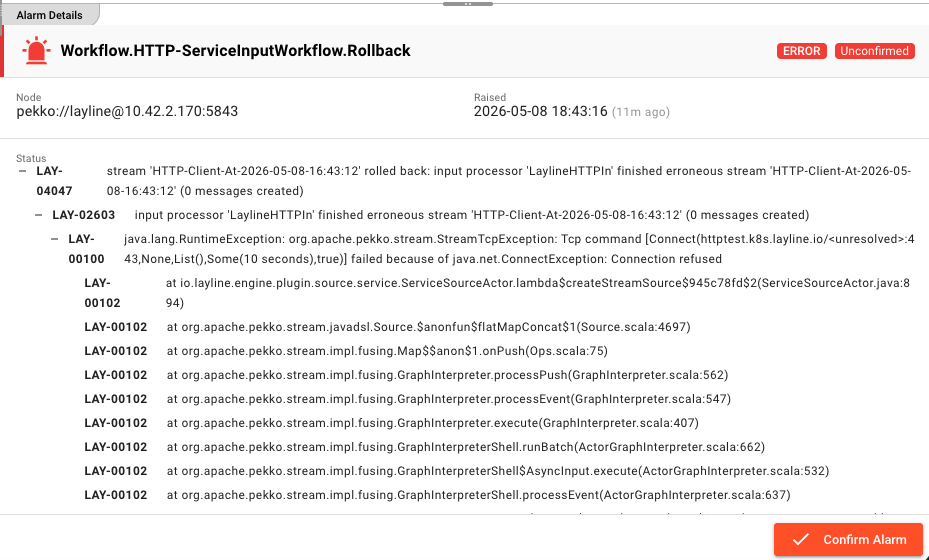 Expanded alarm detail view for Workflow.HTTP-ServiceInputWorkflow.Rollback showing LAY-04047 rollback error, LAY-02603 input processor error, and LAY-00100 connection refused stack trace
For any component showing errors:
- Select the component in Engine State
- Click the Log tab
- Look for error messages around the alarm time
- Check for stack traces or exception details
Common Alarm Types
Runtime Errors
Symptoms: Processor failures, script errors, exceptions
Resolution:
- Check processor logs for the specific error
- Fix JavaScript/Python code issues
- Verify resource availability (memory, disk)
- Restart the component if needed
Connection Failures
Symptoms: Source/sink connection alarms, timeout errors
Resolution:
- Check Connection Asset configuration
- Verify network connectivity
- Confirm external service availability
- See Connection Issues
Resource Exhaustion
Symptoms: Disk full, memory low, thread pool exhausted
Resolution:
- Check cluster node resources
- Free disk space or add storage
- Adjust memory settings
- Review processing load and scale if needed
State Synchronization Issues
Symptoms: CLUSTER_ROLE_MISMATCH, deployment sync failures
Resolution:
- Check cluster node health
- Verify network between nodes
- Review cluster configuration
- May require cluster restart in severe cases
Engine State Reference
Workflow States
| State | Color | Meaning |
|---|---|---|
| HEALTHY | 🟢 Green | Running normally |
| PROCESSING | 🟢 Green | Actively processing messages |
| STARTING | 🟡 Yellow | Initializing |
| STOPPING | 🟡 Yellow | Shutting down |
| INITIALIZATION_FAILED | 🔴 Red | Failed to start |
| ERROR | 🔴 Red | Runtime error |
Service States
| State | Color | Meaning |
|---|---|---|
| UNUSED | 🟢 Green | Available but not used by any workflow |
| USED | 🟢 Green | Active and in use |
| VERIFYING_CONFIGURATION | 🟡 Yellow | Checking config |
| INITIALIZATION_FAILED | 🔴 Red | Failed to initialize |
| DEPENDENCY_FAILURE | 🔴 Red | Required dependency failed |
Resource States
| State | Color | Meaning |
|---|---|---|
| USABLE | 🟢 Green | Available and working |
| UNUSABLE | 🔴 Red | Failed or unavailable |
Responding to Alarms
Confirming Alarms
When you've started working on an issue:
- Select the alarm in Alarm Center
- Click Confirm Alarm
- This silences notifications but keeps the alarm visible
Clearing Alarms
Alarms typically clear automatically when:
- The underlying issue is resolved
- The component recovers
- The alarm condition no longer exists
Some alarms may need manual clearing after verification.
Prevention
Proactive Monitoring
- Regular review: Check Alarm Center daily
- Dashboard setup: Use Engine State for at-a-glance health
- Trend analysis: Look for recurring issues
Configuration Best Practices
- Validate before deploy: Always run validation
- Test in dev: Verify changes in development first
- Monitor resources: Watch disk, memory, CPU trends
- Set up alerts: Configure notifications for critical alarms
See Also
- Alarm Center — Managing system alarms
- Engine State — Live system monitoring
- Cluster Management — Cluster health and configuration