Alarms
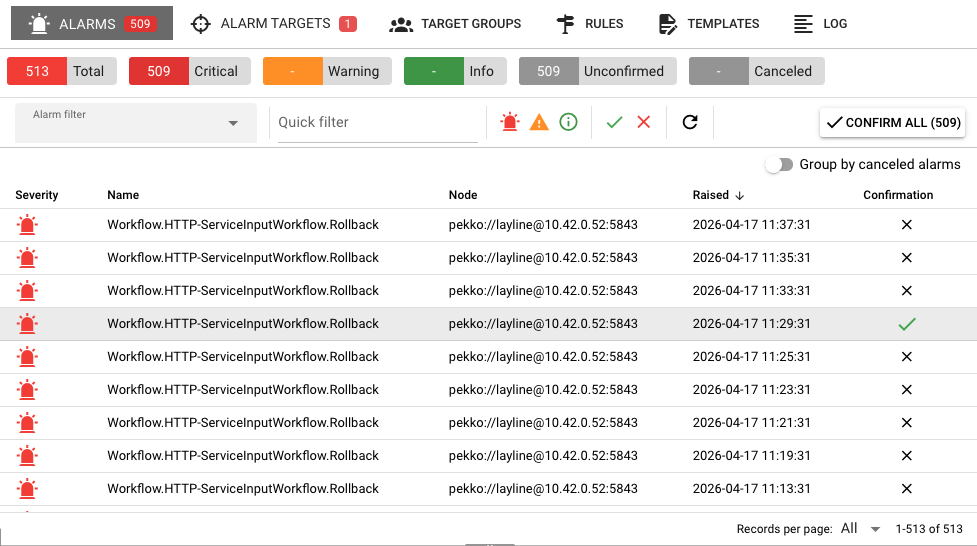
The Alarms tab is the default view of the Alarm Center. It shows all triggered alarms for the selected cluster and provides tools to filter, sort, confirm, and inspect them in detail.
Layout
The tab is split into two main areas:
- Top: Alarm toolbar — Contains filters, refresh controls, and bulk confirmation actions.
- Bottom: Splitter view — Top side shows the alarm table; bottom side shows the details of the selected alarm.
Alarm table
The table displays one row per alarm with the following columns:
| Column | Description |
|---|---|
| Severity | Icon indicating Error (red bell), Warning (orange triangle), or Info (green info). Canceled alarms show a grey "alarm off" icon. |
| Name | The alarm name. When "Group by canceled alarms" is enabled, child alarms are indented with a right-arrow icon. |
| Node | The cluster node where the alarm originated. Displays N/A for cluster-level alarms. |
| Raised | Timestamp when the alarm was first raised. |
| Confirmed | Shows a green check if confirmed, a spinner if confirmation is in progress, or a close button you can click to confirm the alarm manually. |
Sorting
Click any column header to sort ascending or descending. By default the table sorts by Raised in descending order (newest first).
Group by canceled alarms
In the top-right of the table there is a toggle labeled "Group by canceled alarms"`. When enabled:
- Canceled alarms are indented beneath the alarm that canceled them.
- This makes it easy to see cause-and-effect relationships.
- If the currently selected alarm was canceled by another alarm, that "activating" alarm is highlighted with a blue left border.
Toolbar controls
Alarm filter
A dropdown labeled Alarm filter lets you choose between:
- Custom filters — Filters you have created and saved.
- Add new filter — Opens a dialog to create a saved filter with custom criteria.
Each saved filter can be edited or deleted directly from the dropdown by clicking the pencil or trash icons next to it.
Quick filter
A text input labeled Quick filter filters the alarm list by matching text against alarm names. Typing here automatically clears any selected custom filter.
Severity toggles
Three icon buttons filter alarms by severity. Click to include or exclude that severity:
| Button | Color | Severity |
|---|---|---|
| Bell | Red | Error |
| Triangle | Orange | Warning |
| Info circle | Green | Info |
Confirmation toggles
Two icon buttons filter by confirmation state:
| Button | Color | State |
|---|---|---|
| Check | Green | Confirmed by user |
| Close | Red | Not confirmed by user |
Refresh
The refresh button reloads the alarm list from the cluster. This is useful if you are waiting for new alarms or status changes.
Confirm all
If there are unconfirmed alarms visible in the filtered table, a Confirm all button appears on the far right. Clicking it confirms every visible unconfirmed alarm sequentially. A spinner and progress counter are shown during the operation, and you can cancel after the current alarm finishes.
Alarm details panel
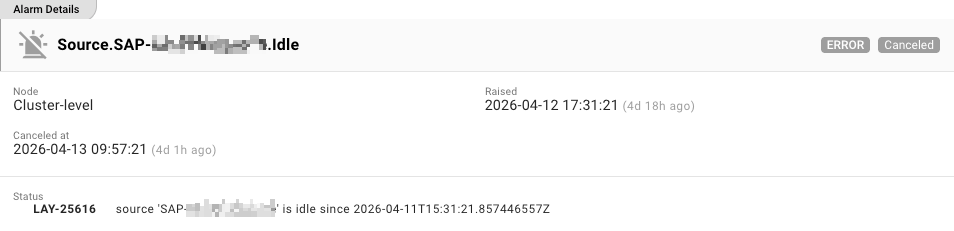
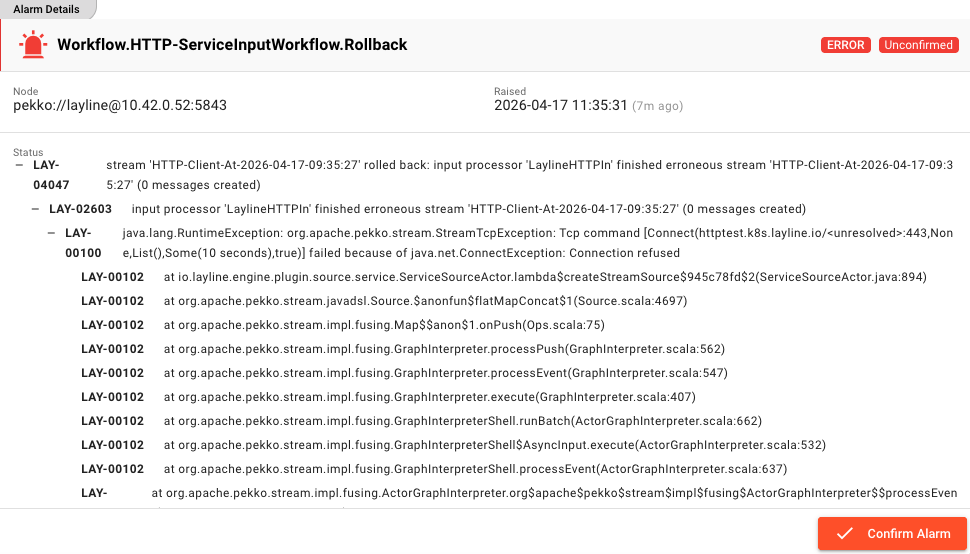
When you select an alarm in the table, the right panel shows its full details.
Header
The header displays:
- Severity icon and name — Large icon and alarm name.
- Severity badge —
Error,Warning, orInfo. - State badge —
Confirmed(green),Canceled(grey),Confirming...(blue), orUnconfirmed(red).
The left border of the header is color-coded to match the alarm severity.
Metadata fields
| Field | Description |
|---|---|
| Node | The node that raised the alarm, or Cluster-level if it applies to the entire cluster. |
| Raised | The exact timestamp with a relative indicator such as 5m ago. |
| Confirmed at | (Only if confirmed) The confirmation timestamp with relative time. |
| Canceled at | (Only if canceled) The cancellation timestamp with relative time. |
A canceled alarm shows both the raised and canceled timestamps, along with the status code that identifies the condition:
Status
The Status section displays the full status message associated with the alarm. This is often a stack trace, error message, or descriptive text explaining why the alarm was raised.
Actions
For alarms that are neither confirmed nor canceled, a Confirm Alarm button appears at the bottom of the details panel. Click it to mark the alarm as acknowledged.
You can also confirm an alarm directly from the table by clicking the close icon in the Confirmed column.
Severity levels
The Alarm Center recognizes three severity levels:
| Severity | Color | Typical use |
|---|---|---|
Error | Red | Critical failures that require immediate attention, such as engine crashes or deployment errors. |
Warning | Orange | Issues that should be investigated but may not stop processing, such as temporary connection drops. |
Info | Green | Informational events that do not indicate a problem, such as successful operations or minor state changes. |
The tab badge on Alarms shows the count of unconfirmed Error and Warning alarms so you can spot critical issues at a glance.