Log
The Log tab displays the runtime log of the Alarm Center component itself. It is useful for diagnosing issues such as:
- Failed target initializations
- Authentication errors (OAuth, SMTP)
- Rule evaluation problems
- Message delivery failures
- Internal Alarm Center exceptions
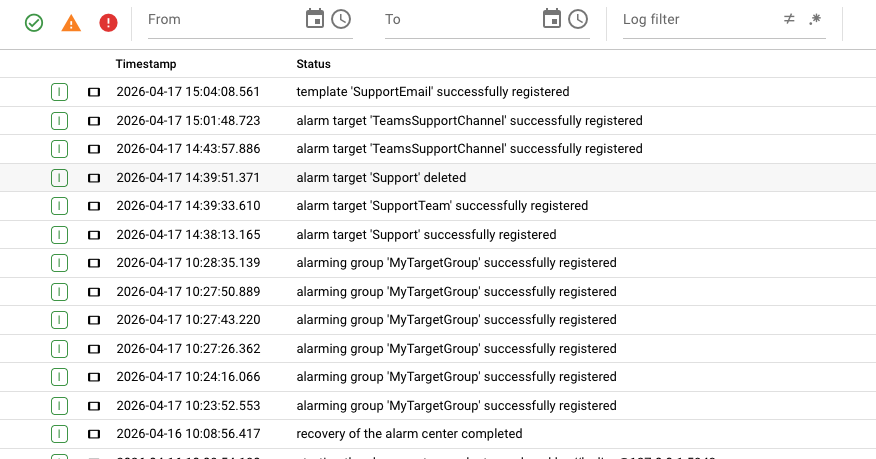
What the log shows
The log is a live or near-live stream of log events emitted by the Alarm Center service running on the cluster. Each entry typically includes:
- Timestamp — When the event occurred.
- Level — Severity of the log entry (e.g.,
INFO,WARN,ERROR). - Message — The actual log message describing what happened.
- Stack trace — For errors, an expanded stack trace may be available.
How to use the log
- Open the Alarm Center.
- Click the Log tab.
- The log view loads automatically and shows the most recent events.
- Use the log controls to:
- Scroll through older events.
- Refresh or auto-follow the tail of the log (depending on the cluster log viewer implementation).
- Filter by log level or search for specific text.
- Select an event to view its full details in a side or bottom panel.
When to check the log
| Symptom | What to look for in the log |
|---|---|
| Target shows a red failure icon | Errors during target startup or OAuth token refresh. |
| Emails are not arriving | SMTP connection failures, authentication rejections, or MS 365 API errors. |
| Teams messages are missing | Graph API errors, missing scopes, or invalid channel/chat IDs. |
| Alarms are not being sent | Rule evaluation errors or target lookup failures. |
| Alarm Center UI feels slow | Warnings about timeouts or high polling load. |
tip
Each individual target also has its own Log tab inside the Alarm Targets details panel. If the Alarm Center log is too noisy, navigate to the specific target and inspect its dedicated log instead.